
Diagnosing the Invisible: How We Enhanced CDN Caching Visibility to Prevent 404 Failures
Milliseconds matter in today’s hyper-connected digital world, and content delivery must be seamless, reliable, and globally scalable. At DIGIS Squared, we’re committed to going beyond surface-level metrics to detect and resolve the subtle issues that impact end-user experience at scale.
Milliseconds matter in today’s hyper-connected digital world, and content delivery must be seamless, reliable, and globally scalable. At DIGIS Squared, we’re committed to going beyond surface-level metrics to detect and resolve the subtle issues that impact end-user experience at scale.
One such challenge we’ve recently tackled involved intermittent 404 errors and browsing failures caused by CDN (Content Delivery Network) caching problems. What appeared to be random access issues turned out to be symptoms of deeper inefficiencies in how content was cached—and more importantly, how that caching was monitored.
The Hidden Problem: When the Cache Misses
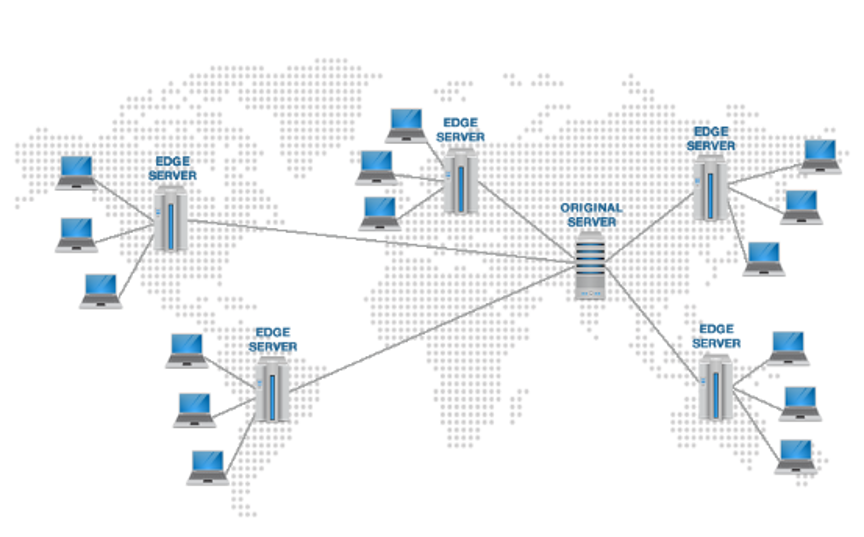
CDNs are the unsung heroes of modern web performance. By distributing content across global edge servers, they reduce latency, offload origin traffic, and enable resilient access for users worldwide. But when caching fails, whether due to misconfigured TTLs, cache-busting headers, or regional edge node discrepancies the impact can be significant:
- End-users encounter 404 errors or content that fails to load
- The origin server receives unnecessary load, reducing scalability
- Diagnostics become harder due to lack of cache-level transparency
We noticed these exact patterns in our browsing analytics: certain requests, particularly through Akamai and Cloudflare, were returning failures that didn’t align with backend health or application logic. This pointed to a cache-layer issue, not an application bug.
The Solution: A New Dashboard to Measure CDN Caching Effectiveness
To combat this, we built and deployed a new internal dashboard that focuses on one core KPI: CDN Caching Hit Success Rate.
Here’s what it includes:
CDN Hit/Miss Analytics:
We track whether content is being successfully served from the cache or fetched from the origin, giving us clear indicators of performance degradation.
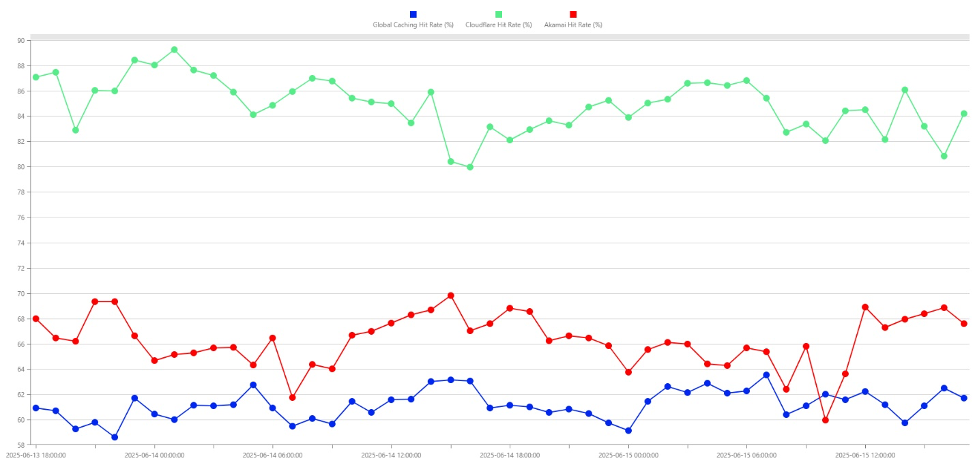
Provider-Specific Breakdown:
The dashboard separately monitors:
- Akamai
- Cloudflare
…two of the world’s most widely used CDN providers, with distributed edge networks and high cache sensitivity.
Unified KPI:
To give a macro-level view, we also calculate a global hit ratio that consolidates data across all CDN providers we observe in browsing sessions, helping us detect broader trends or cross-provider anomalies.
Root Cause Visibility:
Combined with error codes like 404, we can now correlate browsing failures directly to cache misses. This has already enabled us to:
- Identify content types with poor caching behavior
- Advise clients on improving their CDN TTL, cache-control headers, and edge rule configurations
- Proactively alert when hit ratios drop below optimal thresholds
Why This Matters to Telecom & Digital Experience Teams
For operators, OTT providers, and enterprises relying on global content delivery, cache efficiency is no longer a back-end concern; it’s a frontline performance metric. Here’s why this matters:
- A single percent drop in cache hit ratio can significantly increase origin load, affecting cost and latency
- In telecom, real-time browsing quality KPIs are vital to SLA monitoring and customer retention
- Cache failures often go unnoticed because traditional monitoring tools don’t surface them unless there’s a full outage
By adding this caching intelligence into our performance analytics suite, we’re enabling smarter diagnostics, better QoE benchmarking, and deeper insights across the full delivery chain from device to content edge.