Private networks are dedicated communication networks built for a specific organization or use case
Benefits
- Enhanced security and data privacy
- Improved network performance and reliability
- Customized coverage and capacity
- Integration with existing systems and infrastructure
A private (mobile) network is where network infrastructure is used exclusively by devices authorized by the end-user organization.
Typically, this infrastructure is deployed in one or more specific locations which are owned or occupied by the end-user organization.
Devices that are registered on public mobile networks will not work on the private network except where specifically authorized.
Formally these are known as ‘non-public networks’ however the term private network is more commonly used across vertical industries.
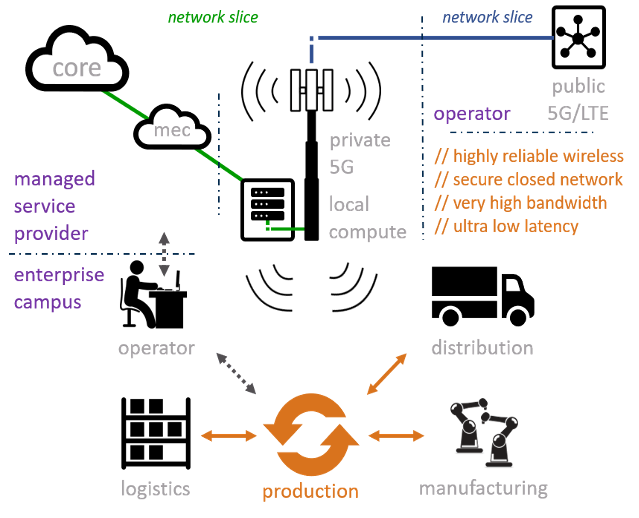
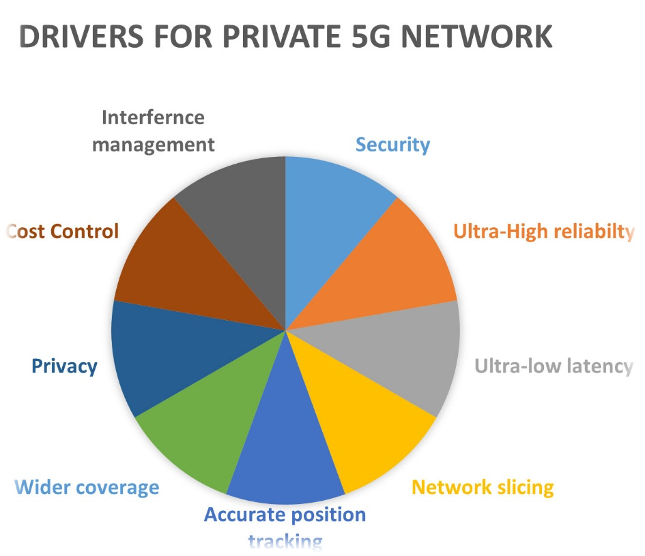
Drivers of having a 5G Private network
Network Performance: with eMBB, URLLC and MMTC, 5G is very capable in terms of network performance
5G Security: The fifth generation of networks is more secure than the 4G LTE network because it has identity management, privacy, and security assurance
New Spectrum in 5G: availability of shared and dedicated 5G spectrum in several bands
Network Coverage: With 5G network, you control where to deploy your gNB
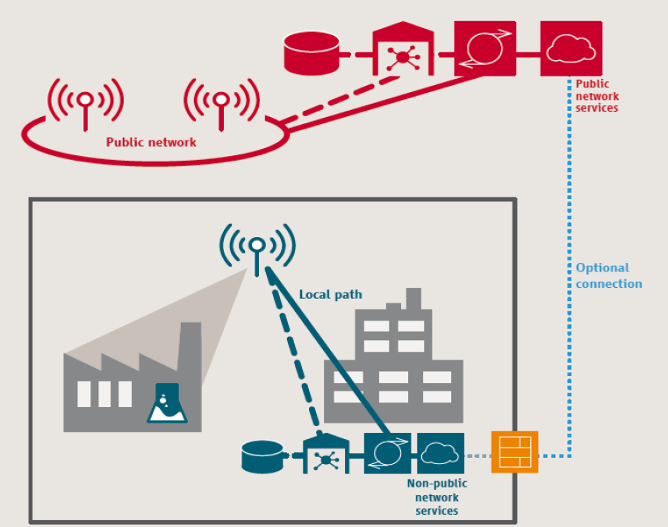
Private Networks Deployment Models
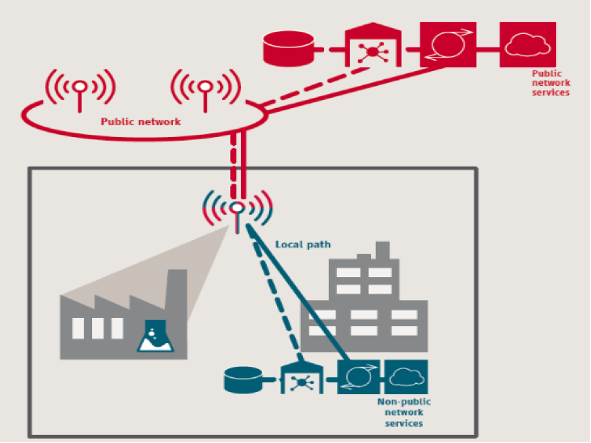
SNPN, Standalone Non-Public Network
NPN is deployed as an independent, standalone network
Private company has exclusive responsibility for operating the NPN and for all service attributes
The only communication path between the NPN and the public network can be done optionally via a firewall
standalone network. Under this deployment model, all network functions are located within the facility where the network operates, including the radio access network (RAN) and control plane elements. Standalone, isolated private networks would typically use dedicated spectrum (licensed or unlicensed) purchased through a mobile network operator (MNO) or, in some cases, directly from government agencies.
PNI-NPN: Public Network Integrated – Non Public Network
- NPN deployed with MNO support: hosted completely or partially on public network infrastructure
- e.g. using Network Slicing
- PNI-NPN has different variants we are going to explain some of them in the coming section
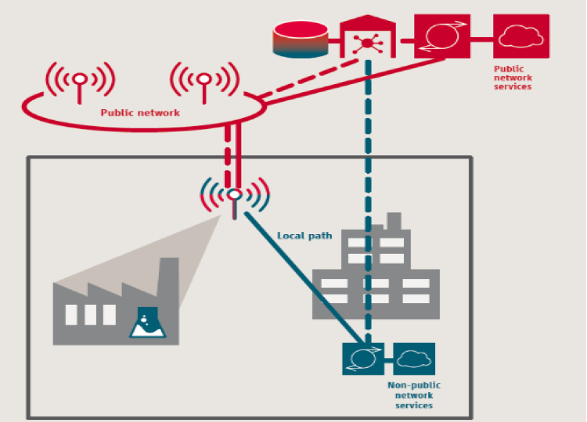
PNI-NPN: Deployment with shared RAN
Shared RAN with dedicated Core
NPN and the public network share part of the radio access network, while other network functions remain separated.
This scenario involves an NPN sharing a radio-access network (RAN) with the service provider. Under this scenario, control plane elements and other network functions physically reside at the NPN site.
This type of deployment enables local routing of network traffic within the NPN’s physical premises, while data bound for outside premises is routed to the service provider’s network. 3GPP has specifications that cover network sharing. (A variation of this deployment scenario involves the NPN sharing both the RAN and control plane functions, but with the NPN traffic remaining on the site where the NPN is located and not flowing out to the public network.)
PNI-NPN: Deployment with shared RAN and Control Plane
Shared RAN and core control Plane.
Both RAN and Core Sharing from control side, with the RAN and Core elements managed by the Public 5G network.
NPN only handles user plane connectivity.
This scenario involves an NPN sharing a radio-access network (RAN) with the service provider. Under this scenario, control plane elements and other network functions physically reside at the NPN site”
PNI-NPN: NPN Deployment in public network
5G Public-Private Network Slice
NPN hosted by the public network
Complete outsourcing of the network, where devices on the private network utilize the Public 5G network RAN.
This scenario can be implemented by means of network slicing
The third primary type of NPN deployment is where the NPN is hosted directly on a public network. In this type of deployment, both the public network and private network traffic are located off-site.”
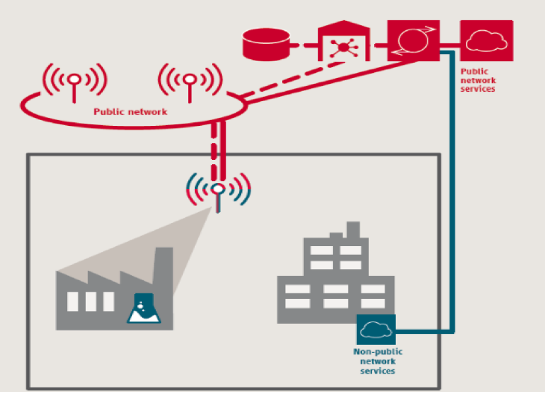
Through virtualization of network functions and in a technique known as network slicing, the public-network operator of the private network partitions between the public network and the NPN, keeping them completely separate.
Challenges of Private Network
Spectrum and Regulations
Limited Spectrum Options: Securing suitable spectrum can be challenging, especially in densely populated or highly regulated regions where spectrum allocation is scarce.
Regulatory Hurdles: Navigating complex regulatory environments to acquire spectrum licenses can be time-consuming and costly, often requiring compliance with specific national or regional regulations.
High Initial Cost
Infrastructure Investment: Setting up a private network requires substantial upfront investment in infrastructure such as base stations, antennas, and network equipment.
Operational Expenses: Beyond initial setup, ongoing operational costs include maintenance, upgrades, and personnel training, contributing to the overall cost burden.
Knowledge acquisition or outsourcing
Technical Expertise: Establishing and maintaining a private network demands specialized knowledge in network design, integration, security, and optimization.
Outsourcing Challenges: Depending on internal resources versus outsourcing, finding capable vendors or partners with expertise in private network implementation can be challenging, affecting project timelines and quality.
Availability and Scope
Geographical Coverage: Ensuring adequate coverage across the desired operational area without compromising signal strength or reliability can be complex, particularly in challenging terrains or remote locations.
Scalability: Designing networks that can scale effectively as operational needs grow, without sacrificing performance or security, requires careful planning and sometimes iterative adjustments.
Integration with Existing IT/OT Systems
Legacy Systems: Many enterprises operate legacy operational technology (OT) systems that aren’t designed to interface with IP-based private networks.
Interoperability Issues: Ensuring seamless integration between IT/OT systems, existing network infrastructure, and the new private network requires careful system design and often bespoke solutions.
Data Flow & Security Consistency: Synchronizing real-time data and maintaining consistent security policies across heterogeneous systems can be complex.
Return on Investment (ROI) and Business Justification
Unclear Business Models: Enterprises often struggle to quantify the ROI of private networks, especially when benefits like reliability and security are intangible.
Cost vs. Benefit Uncertainty: Without clear use cases (e.g., predictive maintenance, robotics, digital twin), the business case can remain weak, delaying decision-making.
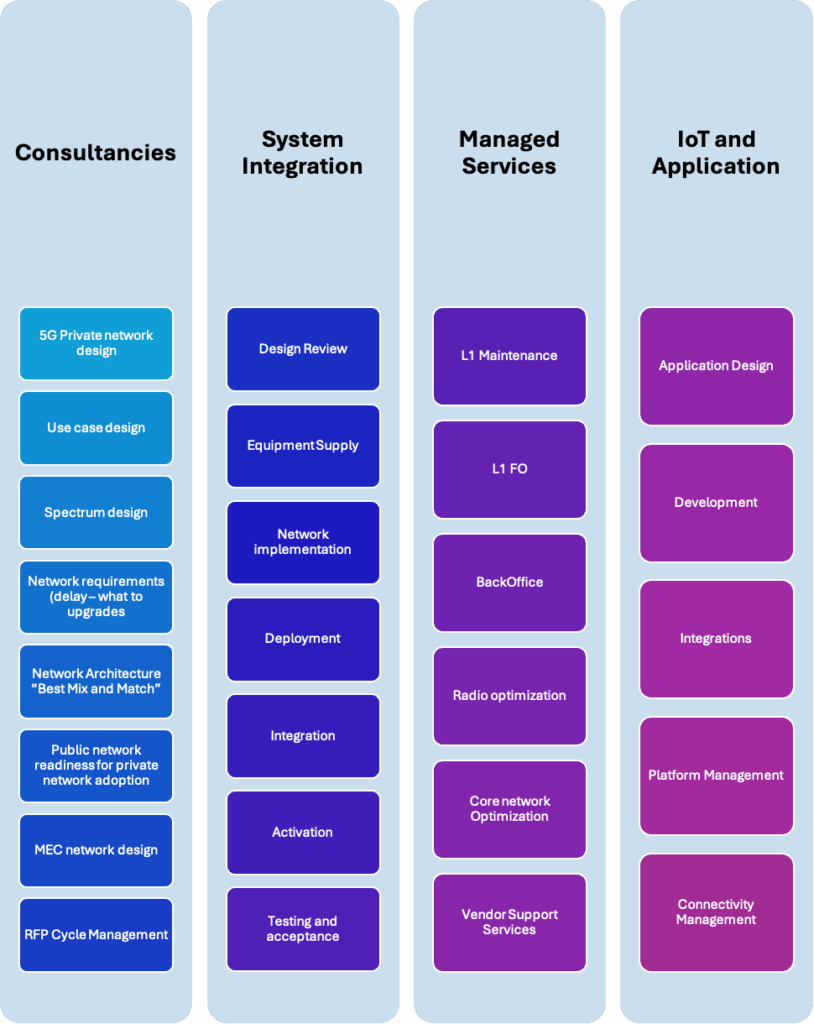
Our Private Networks SI Capabilities
Digis Squared provides Vendor Management & control, operator mindset, helicopter view, program governance, wide experience, class-efficient network solutions & design
We at Digis Squared provide E2E Private Network SI and managed Services journey that could be described as following
This blog post was written by Obeidallah Ali, R&D Director at Digis Squared.